


EN-PDN02 PDN Schematic
 This panel allows the management of power distribution via a visual schematic interface.
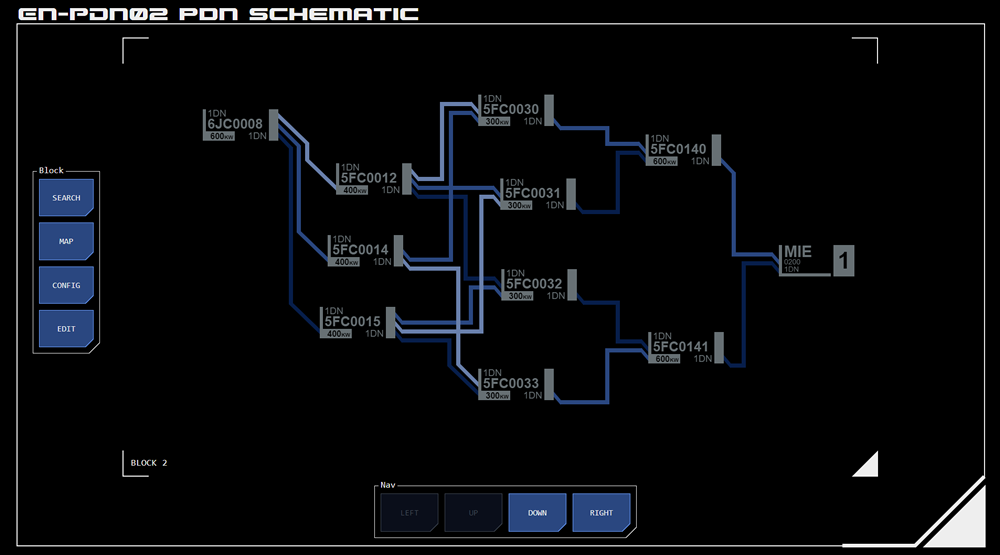
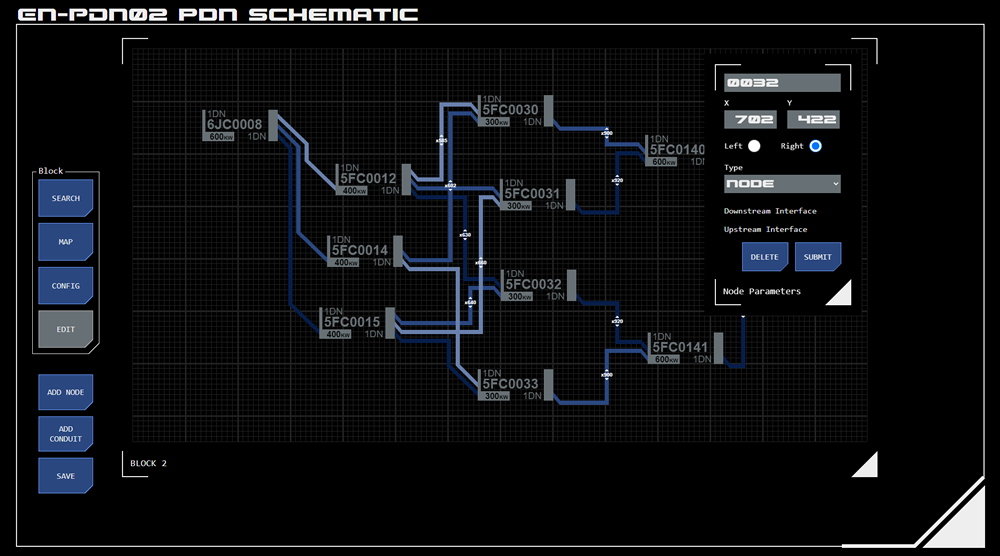
The panel displays a user-selected schematic block, which represents a portion of the PDN. The schematic shows the nodes included in that block and how they are interconnected. The settings of each node are accessible by tapping the node's symbol.
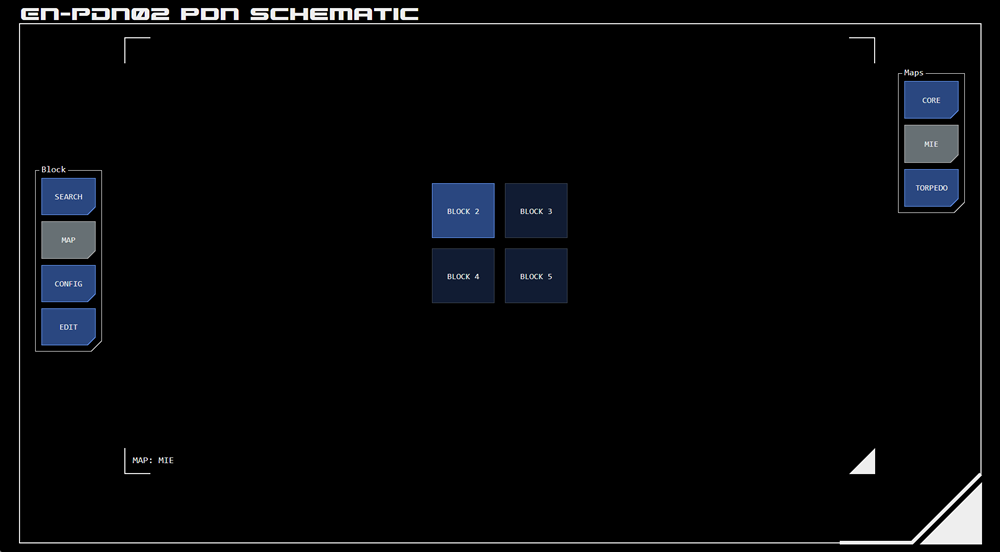
Where a schematic cannot be represented in a single block, a map of blocks is configured. The PDN schematic flows from one block on the map to adjacent blocks.
Overview
The panel consists of main operating menu buttons on the left and the schematic block display area taking up the bulk of space in the middle of the panel. Other controls appear contextually.
Navigation
A number of navigation layers are available.
System Maps
Tapping the MAP button displays system buttons at the right of the panel that when tapped will display a map of blocks for the selected system.
The currently selected system map will be displayed, with the current block highlighted. Tapping one of the blocks on the map opens that block.
Configuration
The system navigation buttons can be configured using the CONFIG button on the main menu
Block Navigation
When a block is displayed, additional navigation buttons are available at the bottom of the block. These allow the user to move directly to an adjacent block in the system map (when following a schematic path that runs across multiple blocks, for example).
Buttons allow for horizontal or vertical navigation, although only available options are active.
Node Display
 Tapping a node on a block will overlay that node's configuration interface.
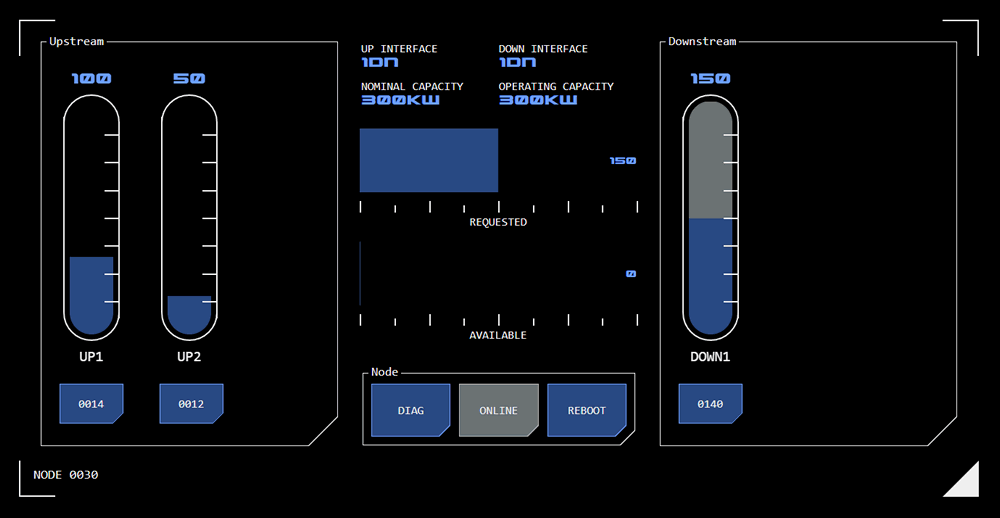
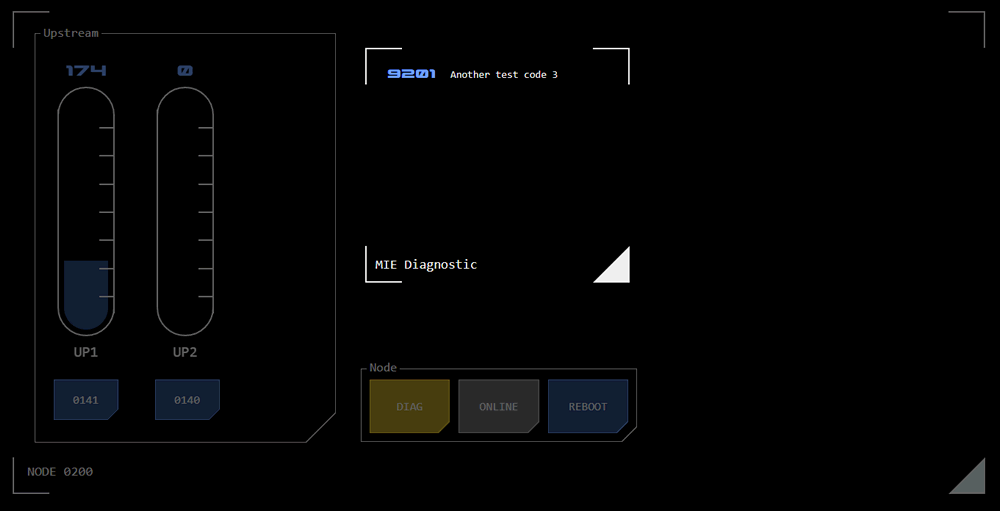
The interface has three parts. On the left are the available upstream nodes. On the right are the available downstream nodes. The centre area displays data about the node's current configuration.
Upstream Nodes
Upstream nodes are the source of power for the current node. Each available upstream node is represented by a linear slider and a button.
The button shows the ID of that node. Tapping the button will replace the current interface with that node's configuration interface.
Power Request
 The linear slider displays the amount of power allocated to the current node using the secondary (grey) slider. The user may request up to that much power using the primary (blue) slider.
Downstream Nodes
Downstream nodes receive power from the current node. Each available downstream node is represented by a linear slider and a button.
The button shows the ID of that node. Tapping the button will replace the current interface with that node's configuration interface.
Power Allocation
The amount of power allocated to each downstream node is set using the linear sliders. The secondary slider is not used - when the maximum power available to the current node has been allocated, the linear sliders will not advance any further and flash an error state.
Node Status
The centre area displays information about the node's configuration, including its upstream and downstream interface types, its maximum power rating and current capability (where degraded by damage, for example).
Linear monitors display the amount of power requested from upstream nodes and how much of that power is available to be allocated to downstream nodes.
Node Buttons
Buttons are provided to manage basic node operation and access diagnostics.
Diagnostics
The DIAG button indicates the node's current operating status. If the button displays selected state (blue) then node status is nominal.
Other conditions are indicated as:
Alert state indicates subnominal status
Alarm state indicates the node is inoperable
Tapping the DIAG button will display an overlay with any current diagnostic codes, which can assist with troubleshooting any issues.
Online Status
The ONLINE button indicates whether the node is online (select (grey) state) or offline (available (blue) state). Tapping the button will toggle between online and offline states.
 If the ONLINE button shows offline state then the system is inoperable and tapping it will have no effect.
System Reboot
The REBOOT button will power-cycle the node's control system. Depending on the issue (as indicated by the diagnostic code) this may clear the issue and return the system to nominal status.
The time needed to complete a reboot may vary between nodes depending on its function and configuration.
Editing Blocks
Schematic blocks can be edited from this panel. Edit mode is entered by tapping the EDIT button, which displays a grid behind the schematic block.
Procedures for editing blocks is covered in a separate article.
Concept Site
Immersive sci-fi and how to join the adventure
Crew Site
Information and tools for ISDC crew members


