


SC-SCN01 Scan Analysis
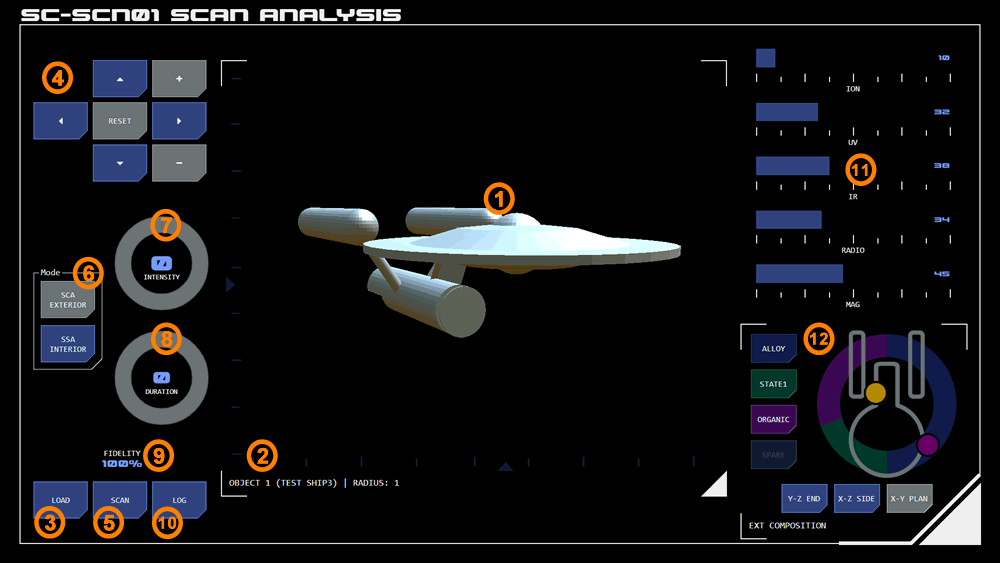 The direct scan system uses a a range of sensor technologies to analyse the configuration of objects in space.
The scan analysis panel displays a 3D visualisation of the targeted object. The fidelity of the visualisation is improved as more data is gathered.
This panel works in conjunction with the active scan panel which is used to select the scan target.
1. Visualisation
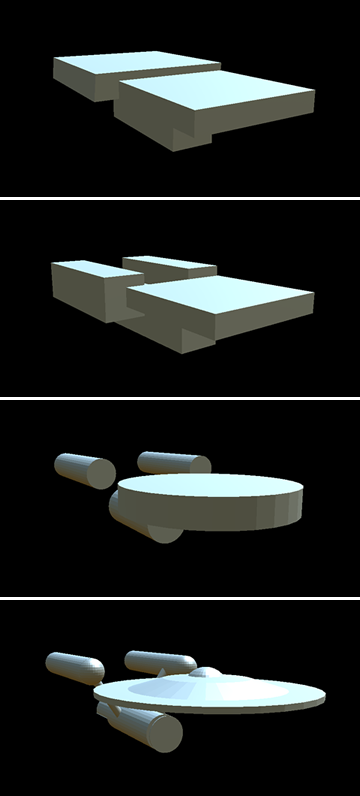 The data collected by a direct scan can be used to provide a 3D visualisation of the object.
2. Displayed Object
The current object's designation is displayed here. The designation correlates with the list of objects on the active scan panel.
Where sufficient scan data is available the object's radius is displayed. The radius is calculated from the smallest sphere that would contain the object.
The displayed object can be changed by tapping the SCAN button on one of the listed objects on the active scan panel.
If no object has been loaded a generic "SCAN VISUALISATION" label is displayed.
If an object designation is displayed but no 3D visualisation is visible, the selected object may not have sufficient scan data to generate a 3D visualisation.
3. Load Visualisation
Tapping this button will display the object currently selected on the active scan panel.
A previously loaded visualisation will remain displayed until a new one is loaded, regardless of which object is currently selected on the active scan panel.
Loading a new visualisation will cause the scan data for the previous object to be replaced.
4. Navigate Visualisation
This keypad is used to move the 3D visualisation in the desired direction by tapping a holding one of the directional buttons. An indicator on each of the X and Y axes indicates how far the object has been rotated relative to its initial scanned position. At this starting position the indicator is centered on its axis.
Tapping the RESET button returns the visualisation to its initial position.
5. Scanning
Scans of the current object can be initiated by tapping the SCAN button. Additional data gathered by the scans will increase the visualisation's fidelity.
The SCAN button displays in alert state while a scan is underway. When the scan is complete, the visualisation updates to reflect the new fidelity level.
Tapping the button during a scan immediately stops the scan, retaining any data gathered up until that point.
6. Scan Mode
These buttons toggle scanning between low power and high power modes.
Exterior (SCA) Mode
Low power Spectral Composition Analysis (SCA) scans are useful for visualising the shape/configuration of an object and the materials from which its exterior are composed.
Interior (SSA) Mode
High power Spectroscopic Structual Analysis (SSA) scans are useful for visualising the interior of an object and internal composition (such as atmosphere, etc).
7. Fidelity
The fidelity of the current object is displayed as a percentage. 100% is the maximum fidelity the system can achieve given the range and/or size of the target object.
8. Scan Intensity
The intensity of the scan can be adjusted using this radial slider.
The greater the intensity the more data is gathered for a given time, although higher intensity also means greater EM output.
Maximum scan intensity is 10.
9. Scan Duration
The duration of the scan (in seconds) can be set here. The scan will automatically stop at the specified time. The scan can be stopped earlier by tapping the SCAN button.
10. Scan Log
If an object has full scan fidelity, the scan can be logged for future reference by tapping the LOG button.
An overlay will appear so that a designation can be entered for the object. Tapping the grey input box will display a keyboard. Tap the INPUT button to enter the designation. If the scan fidelity is insufficient, the INPUT button will be in OFF state and the designation will not be entered.
Tracked Logged Objects
Where an object has been logged and is currently being tracked, the full scan will be displayed when the object is reloaded, even though another object was scanned in the meantime.
Previously Logged Objects
Once an object scan reaches full fidleity, the system will automatically compare it with previously logged objects.
If a match is found, the designation assigned to the logged object will be added to the displayed object display (2).
Tapping the log button for a previously logged object will automatically display the designation in the grey input box where it can be changed if required.
11. EM Levels
The current object's EM output (at the source) is displayed to the right of the visualisation.
12. Composition Analysis
Here
Attachments:
Concept Site
Immersive sci-fi and how to join the adventure
Crew Site
Information and tools for ISDC crew members


