


SC-FRQ01 Peak Frequency Analysis
 The peak frequency analysis system assesses EM radiation passively detected in proximity to the vessel, providing insights into its function and purpose.
Frequency analysis is only possible on EM detections made relatively closer to the vessel (up to 1000 GUs) and higher intensity than for broadband EMDAR (which has a maximum range of 5000 GUs).
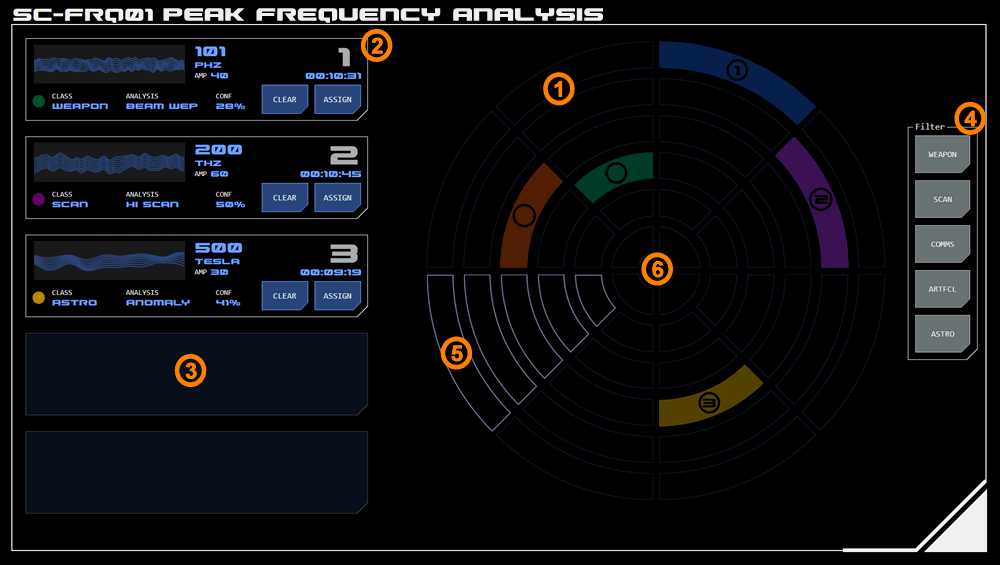
1. Proximity Grid
The proximity grid provides a visualisation of key detection characteristics.
An EM detection is displayed as a solid colour on one of 44 sectors. The colour indicates the detection's functional class using the Standard Designation Display Protocol (SDDP).
The highlighted sector's radial position indicates the estimated direction of the EM source.
The highlighted sectors diametrical position indicates an assessment of how directly the EM was targeted at the vessel, using a combination of proximity, peak intensity and direction.
2. Detection Monitors
 Up to five detections can be monitored in detail by being assigned to this section.
Assigning Detections
To assign a detection to a monitor, on the proximity grid tap the circular indicator in the middle of the target detection. The detection will change to active state.
Tapping an active detection will cancel the selection.
Tap an empty monitor (3) to assign the active detection. Or to replace a detection already assigned to a monitor, tap that monitor's ASSIGN button. The active detection will replace the previous detection.
On the proximity grid, the monitor's designation number will be displayed inside the detection.
Clearing Detections
To clear a detection assigned to a monitor, tap that monitor's CLEAR button. The detection will remain on the proximity grid (shown unassigned) until the detection is expired by the system.
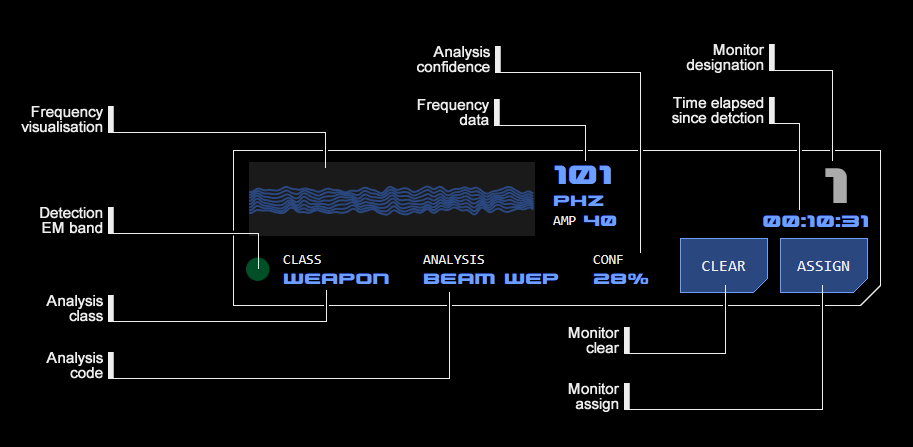
Monitor Data
Each monitor includes raw data for the detection, a visualisation of that data and an assessment of the detection's likely function or prupose based on that data.
Elapsed Time
The time elapsed since the detection was first made is displayed here.
Transitory detections (ie that only manifest briefly) are displayed for a minimum period to ensure they are seen by the operator. As the end of this period draws closer, the timer changes from alert and then to alarm state. When the period ends, the monitor is cleared and the detection disappears from the proximity grid.
Sustained detections (ie that manifest continuously over more than a brief period) are displayed for at least as long as the minimum display period. Detections that are sustained beyond the minimum period will be cleared when they are no longer detectable, without the expiry warning provided for transitory detections.
Visualisation
At the top-left of the monitor is a graph-based visulatisation of the detection over time.
The horizontal axis represents time elapsed. For transitory detections, rather than repreatedly loop the same data through the visualisation the system extrapolates detection behaviour to provide more a intuitive representation.
The vertical axis represents amplitude.
Multiple frequencies within a detection are aggregated based on adjacency into up to eight groups to ensure clarity within the visualisation's limited space.
Frequency Data
To the right of the frequency visualisation is the detections data.
The largest (top) number is the detection's frequency (where necessary averaged). Immediately below this is the frequency's unit (ranging from PHz to MHz for EM and tesla for magnetic detections).
The frequency's amplitude (AMP) is displayed beneath this. To ensure consistency across detections this is represented as an index, with a maximum of 100.
Underneath the frequency visualisation to the left of the monitor is a coloured dot presenting the detection's EM band.
Analysis
An algorithmic analysis of the detection's function and/or purpose is provided underneath the frequency visualisation.
Class: A detection is assigned to a high-level functional class based on an assessment of its frequency, amplitude, modulation (if any) and origin.
Analysis: Where possible a more specific detail as to the detection's likely purpose is provided by the assessment, in the form of an analysis code.
An anomaly code indicates the system is unable to provide additional detail based on the data available.
Confidence (CONF): This indicates the system's confidence in the assessment.
4. Class Filters
It is possible to filter which detection classes are displayed on the proximity grid using this group of buttons.
Where a button is displayed in SELECT state, detections will be displayed on the proximity grid.
Filtering detections does not impact an detections already assigned to a monitor.
 5. Sweep Indicator
The sweep animation provides visual confirmation that the module is constantly monitoring the proximity (where applicable).
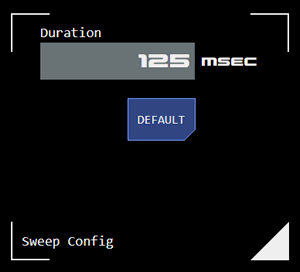
6. Sweep Indicator Configuration
Tapping the very centre of the grid opens the sweep configuration dialog (right).
The number of milliseconds the sweep takes to comlete a full revolution can be set here. This is for display purposes only - it does not adjust the underlying scan rate.
Tapping the default button restores the default setting.
A setting of zero will disable to sweep indicator.
Concept Site
Immersive sci-fi and how to join the adventure
Crew Site
Information and tools for ISDC crew members


