


Related
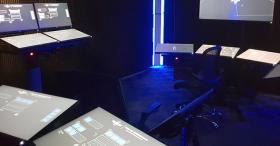

The Vessel Command, Control and Management System (VC2MS) is intended to facilitate intuitive access to relevant system information for rapid diagnosis and control input.
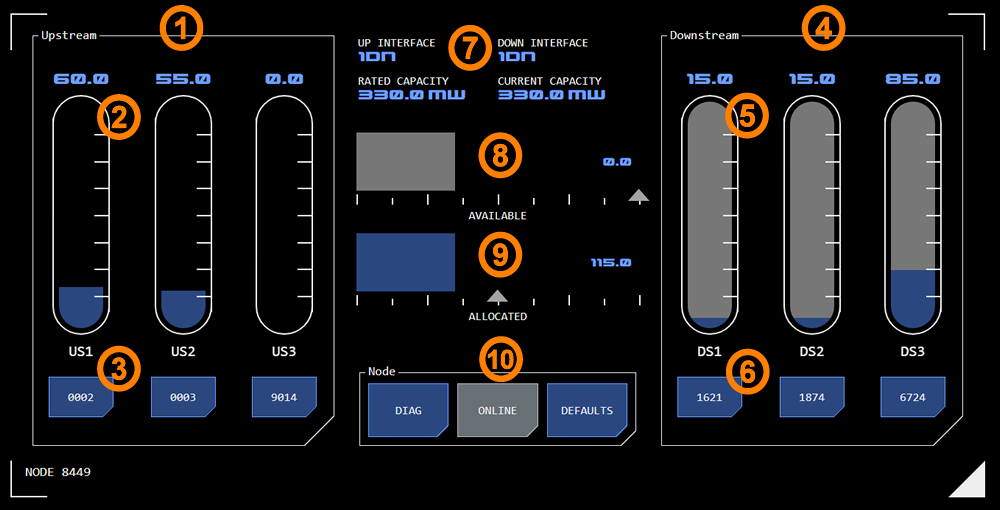
PDN nodes can be configured via a control overlay which is launched when a node symbol is tapped on a PDN schematic or a system button is tapped on a console.
Overview
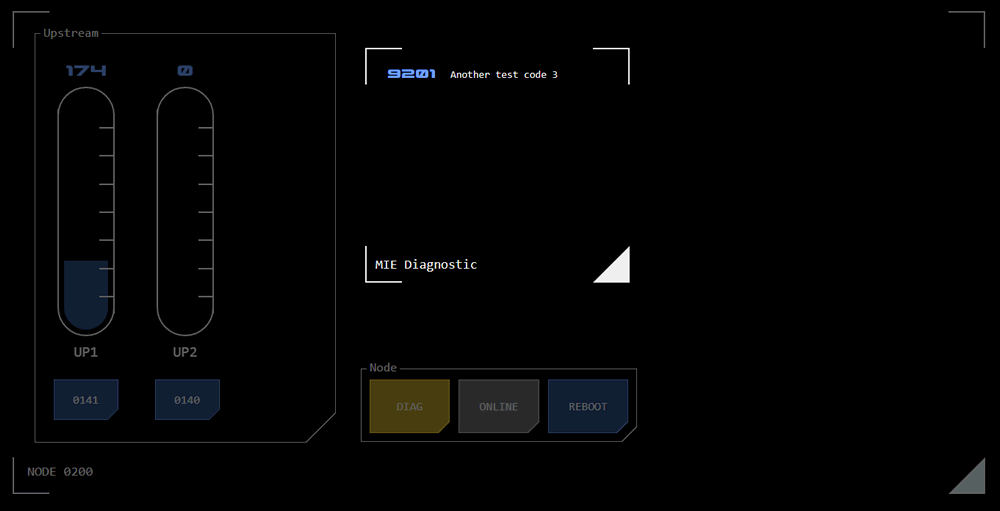
The overlay is made up of three main areas. The node's upstream interface is controlled by the section on the left. The node's downstream interface is controlled by the section on the right. The middle section provides data on the node and current power allocation.
Depending on the node's type, not all of these sections may be displayed.
Node Defaults
Each node will automatically attempt to restore its default settings. This allows for an orderly recovery after a power outage.
Before adjusting any power levels you should disengage these defaults by tapping the DEFAULT button (see section 10 below).
1. Upstream Interface
For system or distribution nodes, the upstream interface will display the node's upstream nodes.
2. Power Request
A linear slider allows the amount of power requested from the upstream node to be selected. The amount of power that can be requested is limited by what has been allocated from the upstream node.
The maximum capacity of each slider is the same as the node's nominal capacity.
3. Upstream Node
A button identifies the connected upstream node. The button will display the node's current status.
Tapping the node button will call up that node in the configuration overlay.
4. Downstream Interface
For distribution or generator nodes, the downstream interface will display the node's downstream nodes.
The grey background for downstream linear sliders is always at maximum as there are no restrictions on how much of the node's available power can be allocated to any one downstream node.
5. Power Allocation
A linear slider allows the amount of power to be allocated to the downstream node to be selected.
6. Downstream Node
A button identifies the connected downstream node.
Tapping the node button will call up that node in the configuration overlay.
Unlike the upstream interface, the button will display the connected conduit's current status (not the downstream node's status).
Conduit Status
The status of conduits connecting downstream nodes is monitored. If there is an issue with the conduit, the colour of the button for the connected downstream node will change to reflect the conduit's status:
Off state: The conduit has been disconnected
Alert State: An issue with the conduit has been detected but delivery of power has not yet been affected
Alarm state: The conduit cannot deliver power
Node Status
The central section of the overlay displays information about the status of the node.
7. Power Standards and Capacity
This section displays the power standards for the node's upstream and downstream interfaces (where they are different, the node will be performing the standards conversion).
Rated Capacity: This is the maximum power throughput the node is rated to handle.
Current Capacity: This is the maximum power throughput the node is currently capable of handling. If this is less than the rated capacity then malfunction or damage may be impacting the node's performance.
8. Available Power
This monitor indicates how much power is available. A blue bar indicates power that is available but not yet allocated to a downstream node. The grey bar behind indicates the total power available to the node (whether allocated or not).
9. Allocated Power
This monitor indicates how much power has been allocated to downstream nodes.
Power Storage (UPS Node)
If a node is equipped with UPS storage it will also display how much storage capacity is currently available in kw/h or mw/h.
10. Node Status Buttons
Three buttons provide information about the node's operating status.
DIAG
This button displays any active diagnostic codes for the node in an overlay.
ONLINE
This button displays and controls the node's current operating status:
Selected State: The node is online.
Available State: The node is offline (deactivated) but can be brought online.
Alert State: The node's operation is subnominal which may impact it's operating capacity. One or more diagnostic codes will typically be available to help identify the issue.
Alarm State: The node is inoperable and cannot be brought online due to malfunction or damage. Depending on the extent of the problem one or more diagnostic codes will be available to identify the cause.
Tapping the button will toggle between the node being online (operating normally) or offline (deactivated).
When in alert state tapping the button will still take the node offline. When the node is brought back online the power cycle may have cleared the issue, otherwise the alert state will resume.
Note that it takes approximately 15 seconds for a node to power down before it can be restarted again. During this time, he ONLINE button will display alert status.
DEFAULTS
This button toggles the node between automatically maintaining its default settings or whether manual control of power allocation has been selected (which is indicated by the button displaying ALERT status).
Node Variants
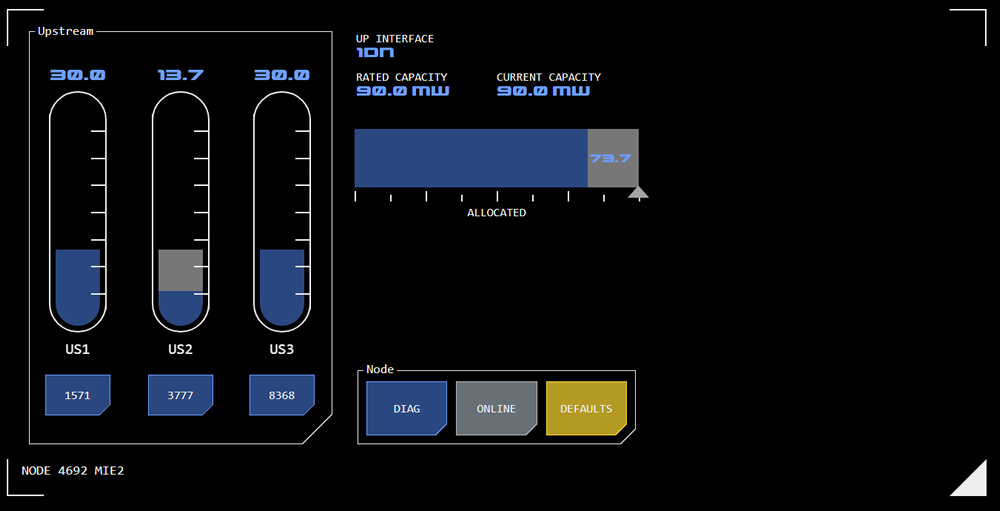
The configuration overlay will look different for nodes that are not distribution nodes.
System Nodes
A system node does not have a downstream interface as it only consumes power.
The configuration overlay for a system node does not display any information for a downstream interface.
Only one power monitor is displayed in the central section. A blue bar indicates the power that has been requested by the system. The grey bar behind indicates the total power available to the node from upstream nodes (whether requested or not).